Football Analytics:
Pass Networks
A pass network is a great way to see players' average position in a game. Furthermore, it also explains the frequency of passes between 2 players.
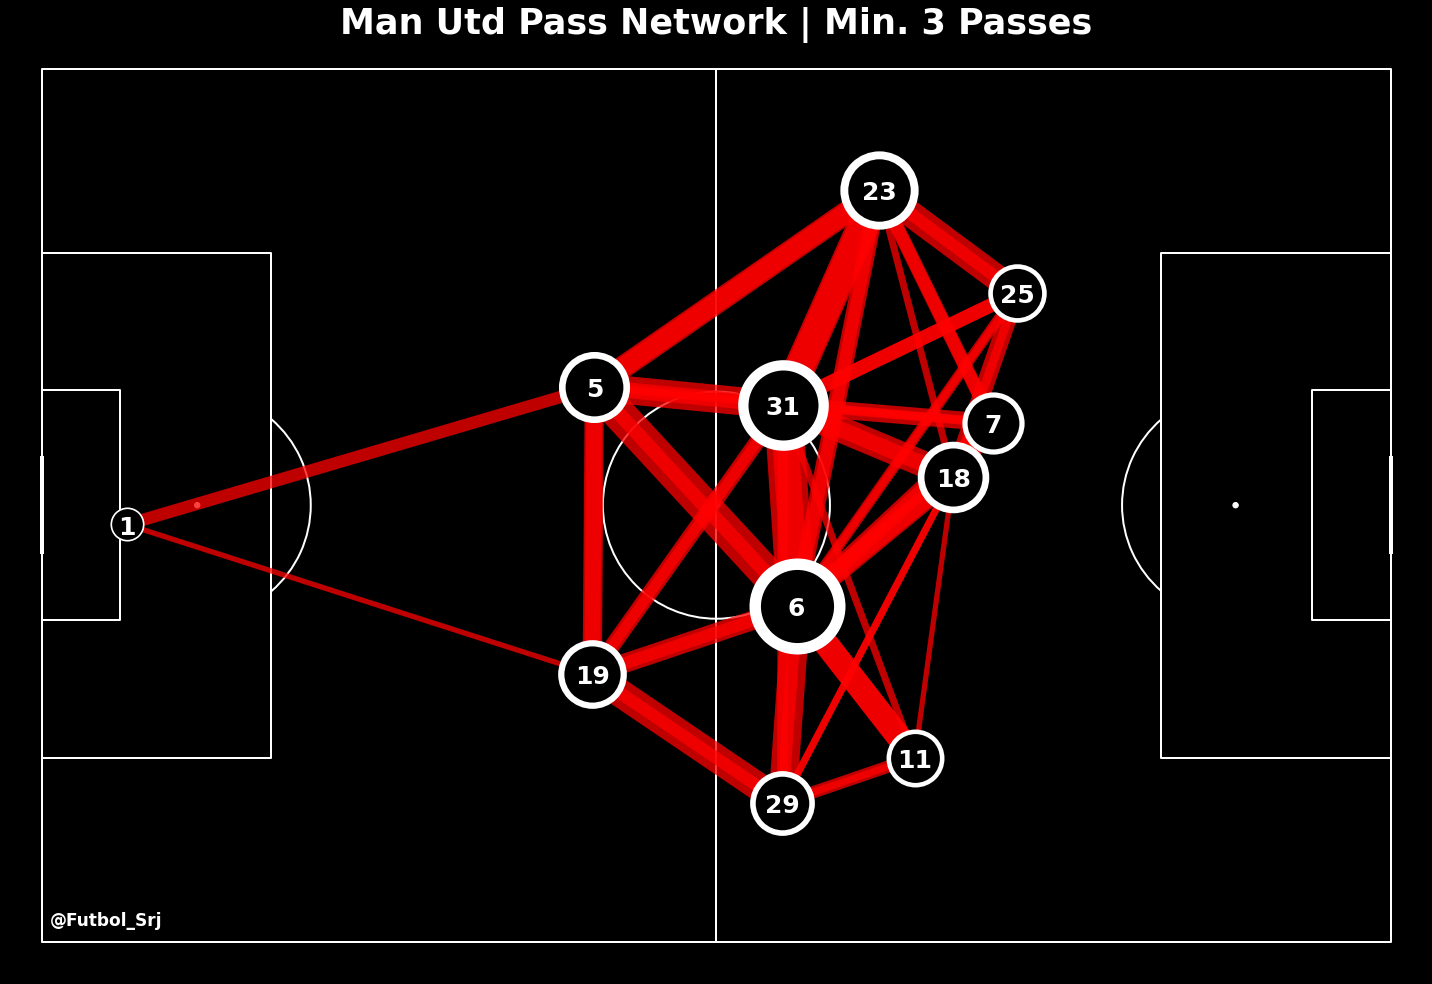
A pass network is a great way to see players' average position in a game. Furthermore, it also explains the frequency of passes between 2 players.

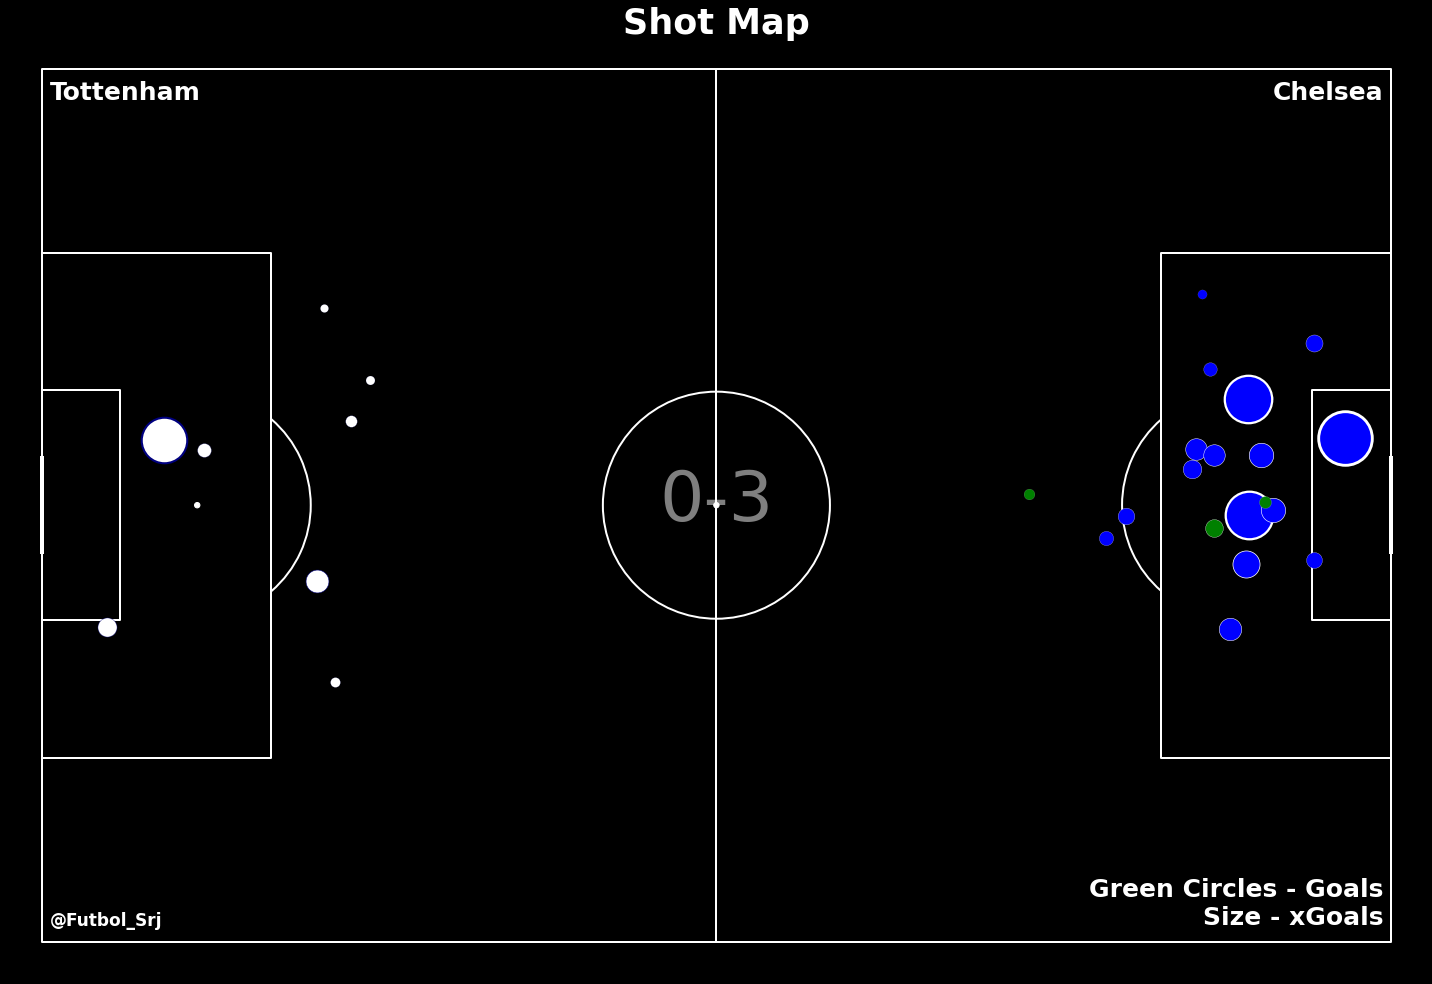
This graph plots all the shots taken in that particular game by both sides. The change in size and colour differentiates the type of shot.
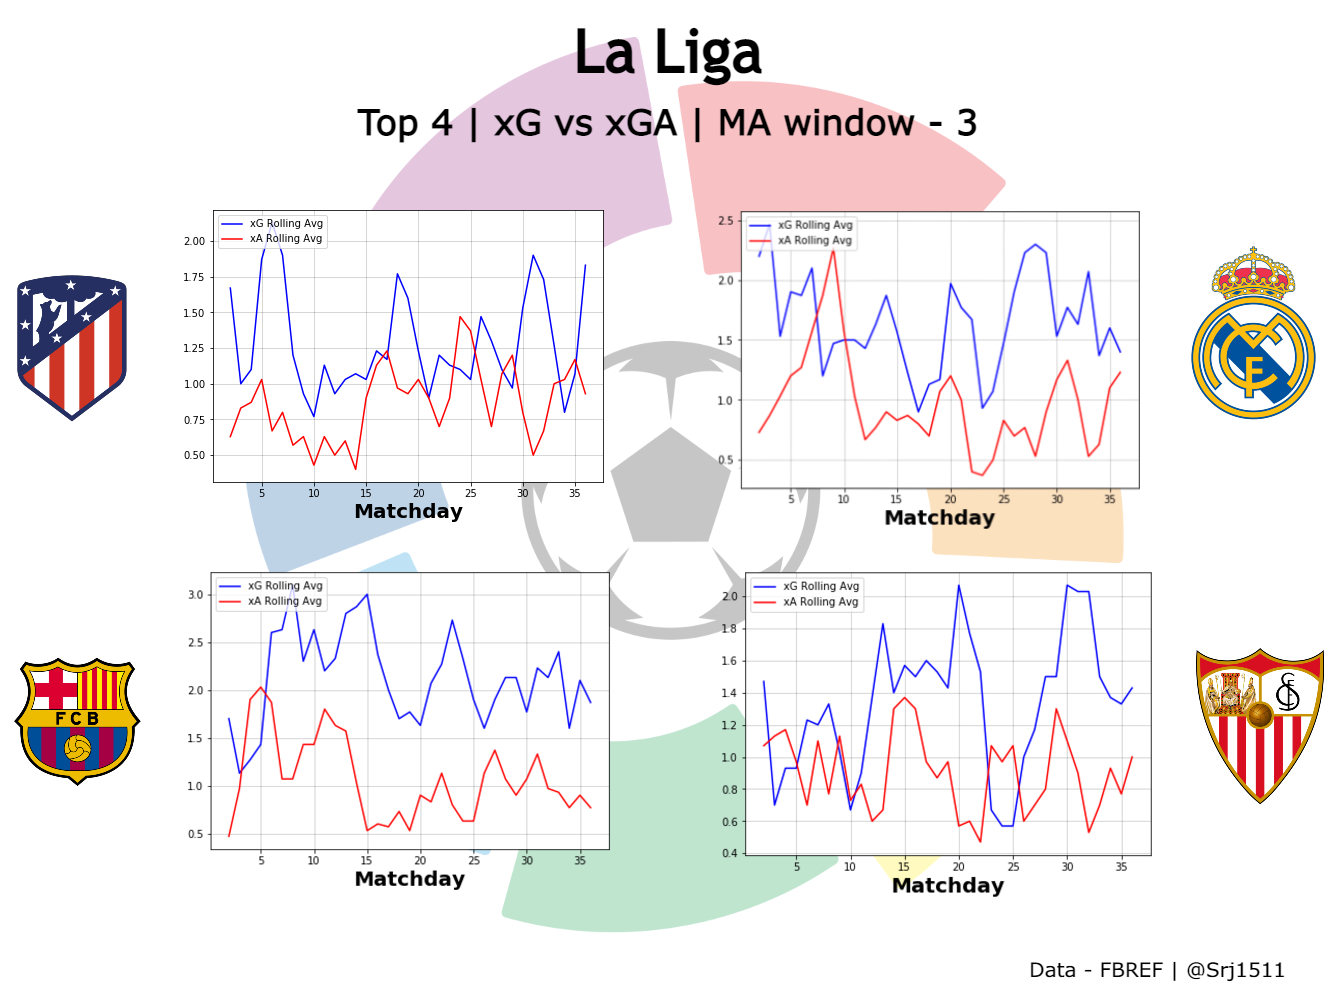
A line graph is possibly the best way to depict moving averages over the course of a season. This is a comparison of Expected Goals against Expected Goals against.
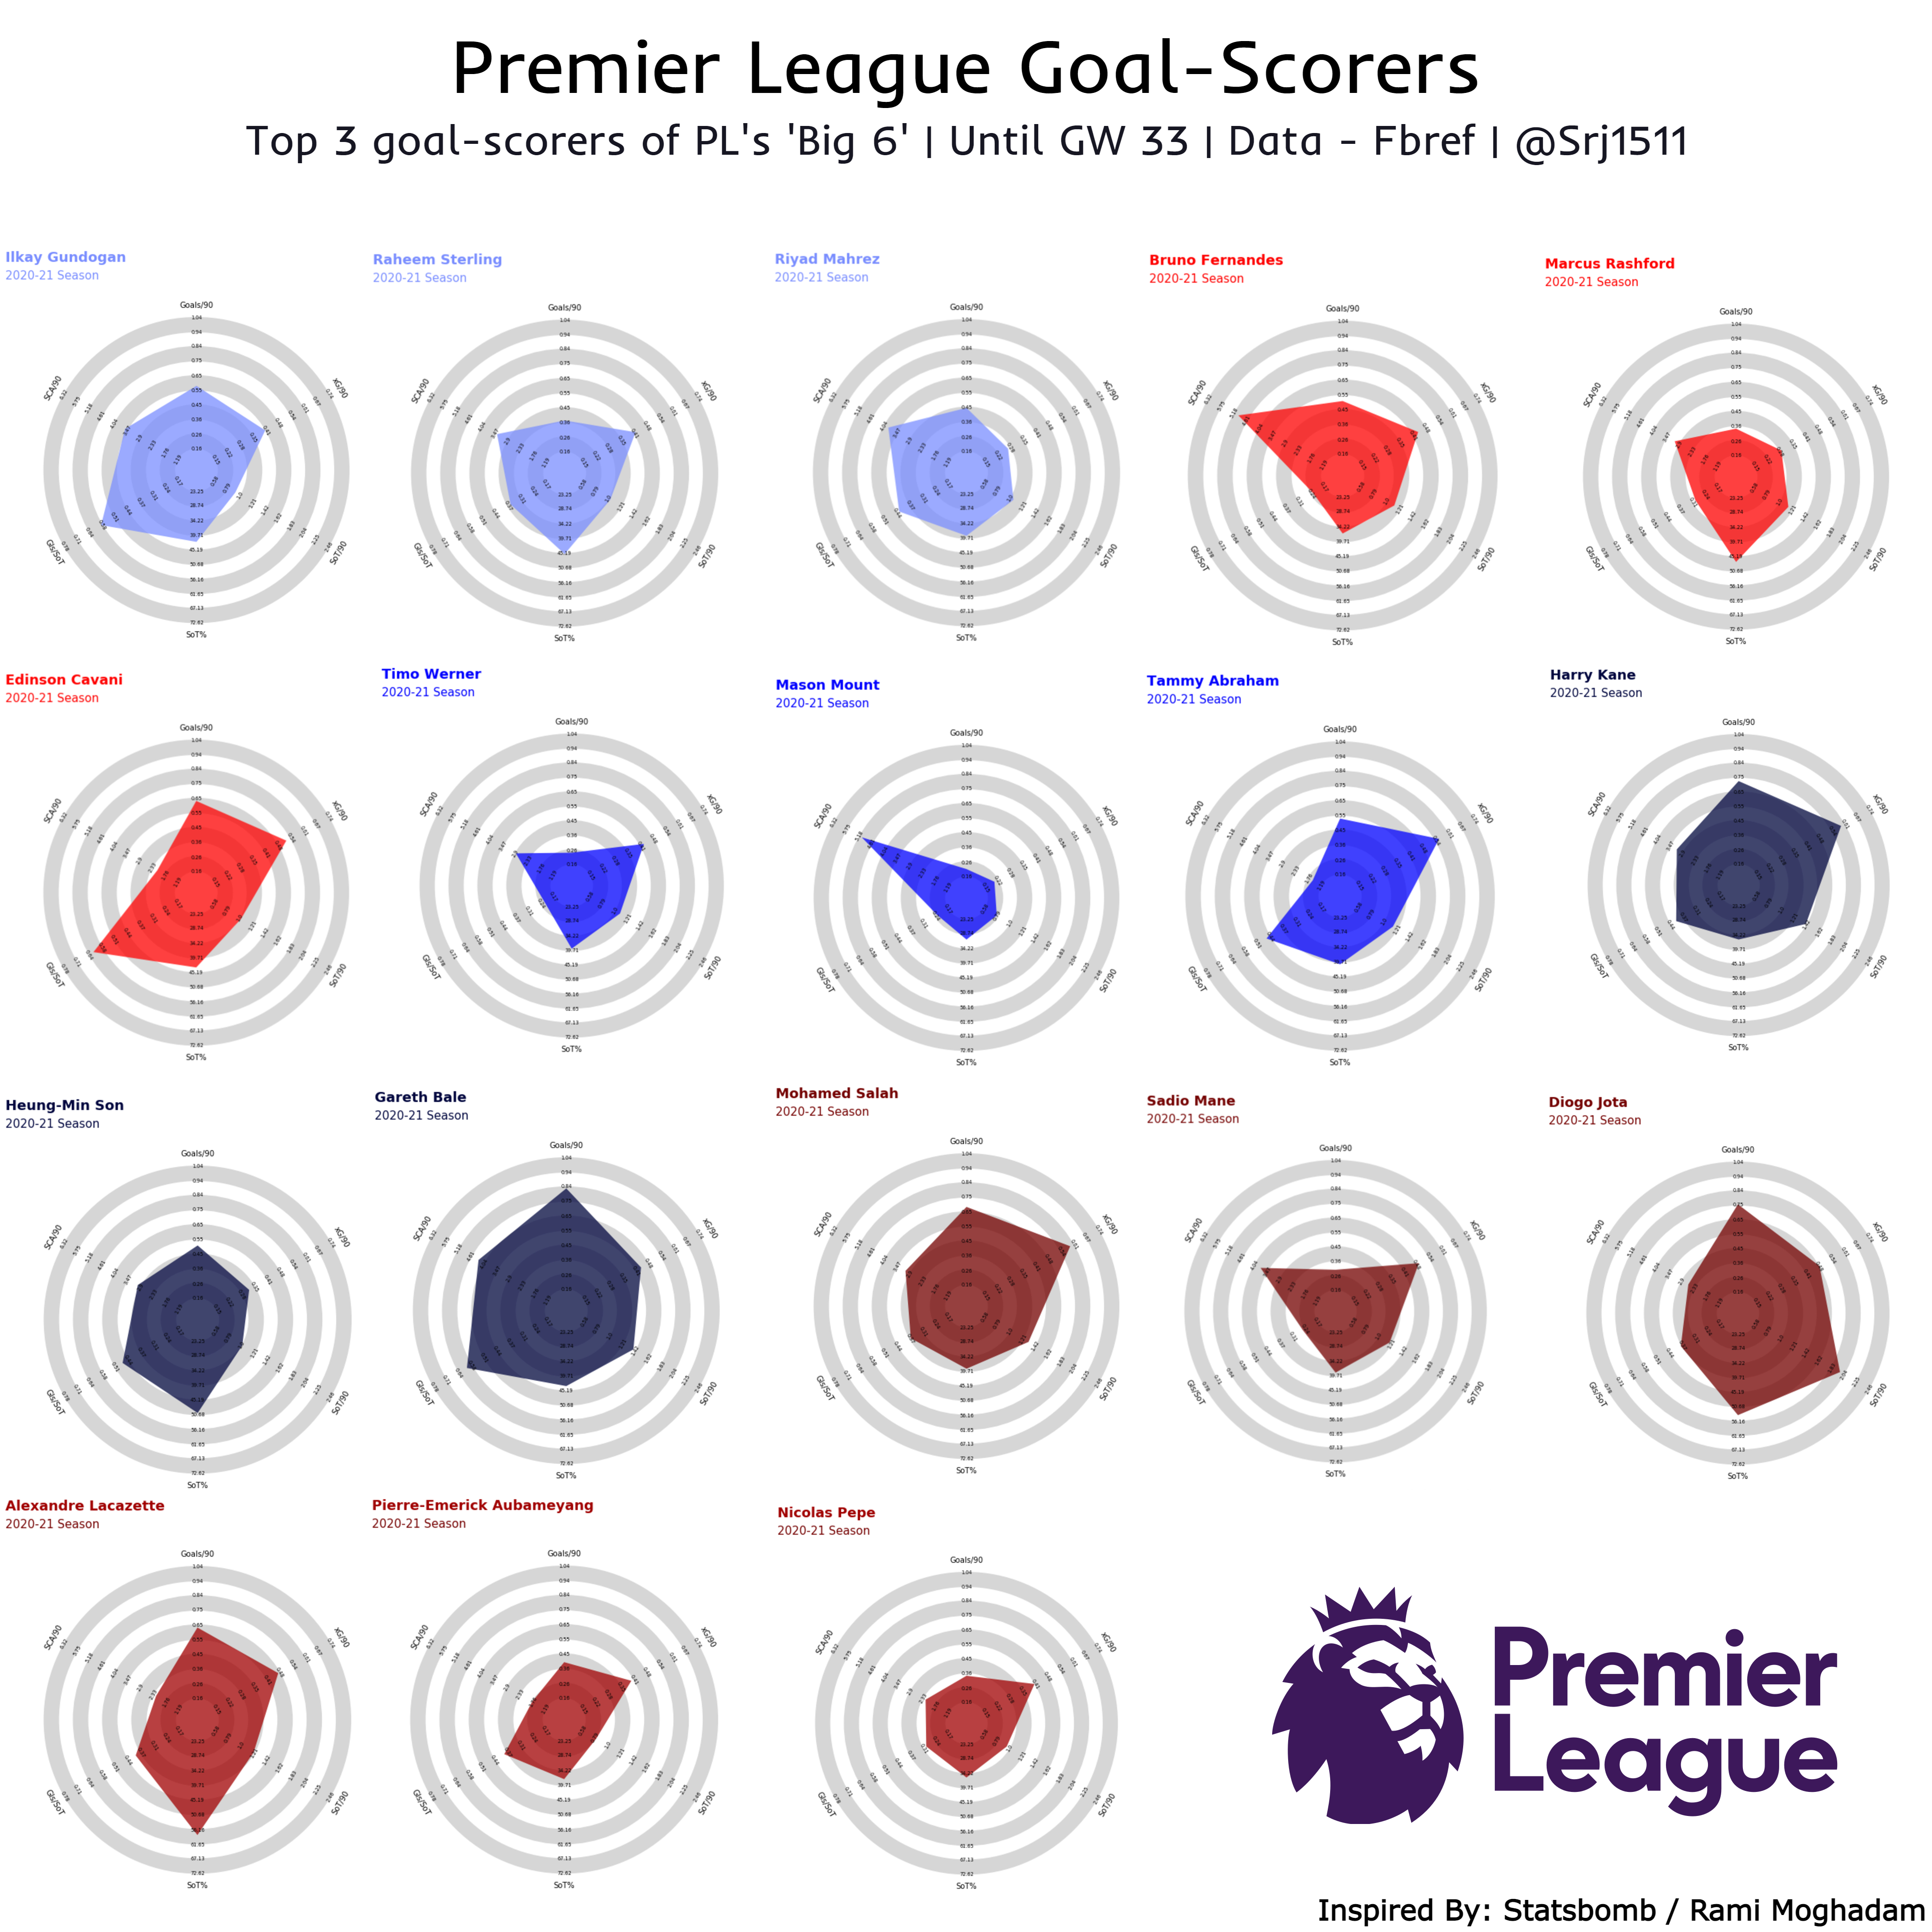
Plotting the top scoreres of the Premier League's "Big 6" sides. They are judged on the same metrics to maintain uniformity.
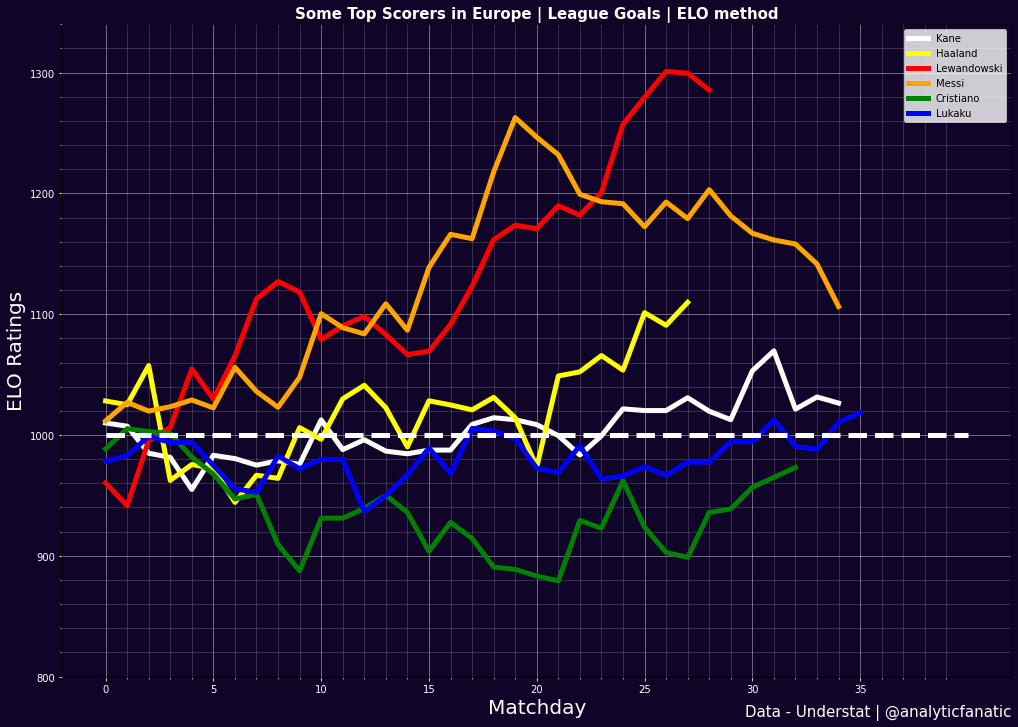
An ELO Rating is the best way to rate two teams or players with respect to each other. It is widely used in chess but why stop there? Despite not being a zero-sum game per se, individual footballers in similar positions can still be compared with each other.
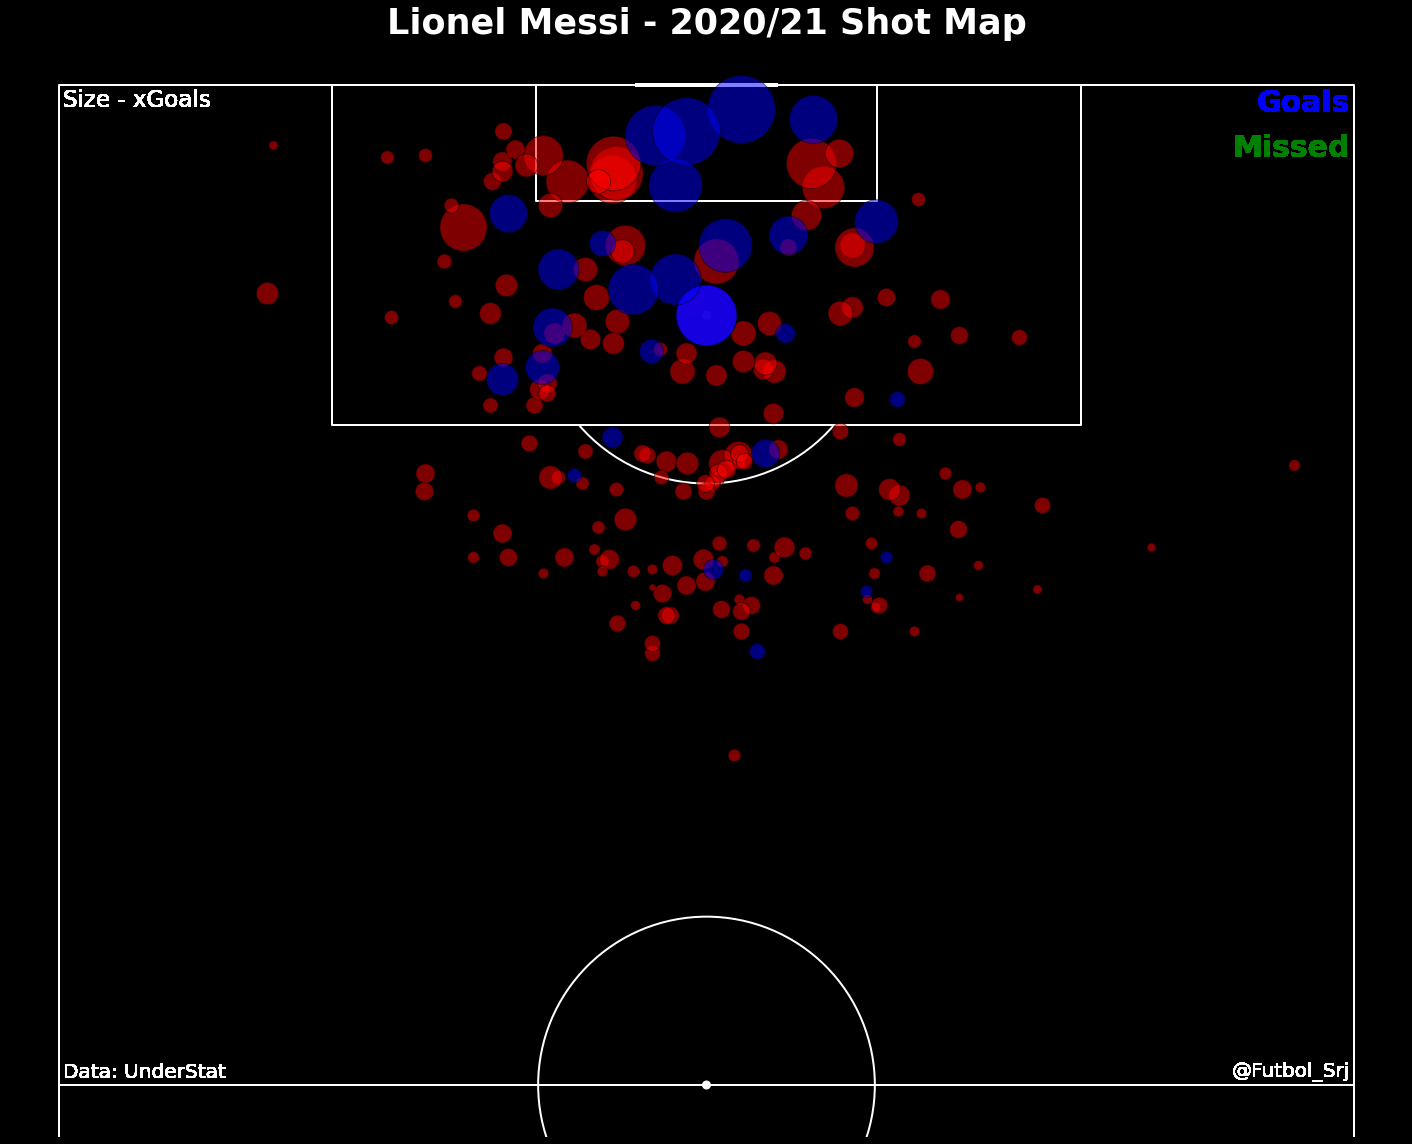
This is good way to visualize a player's shot data. The size of the circle represents xG and colour shows the type of shot. It is useful to ajudge a player's shot selection through this.
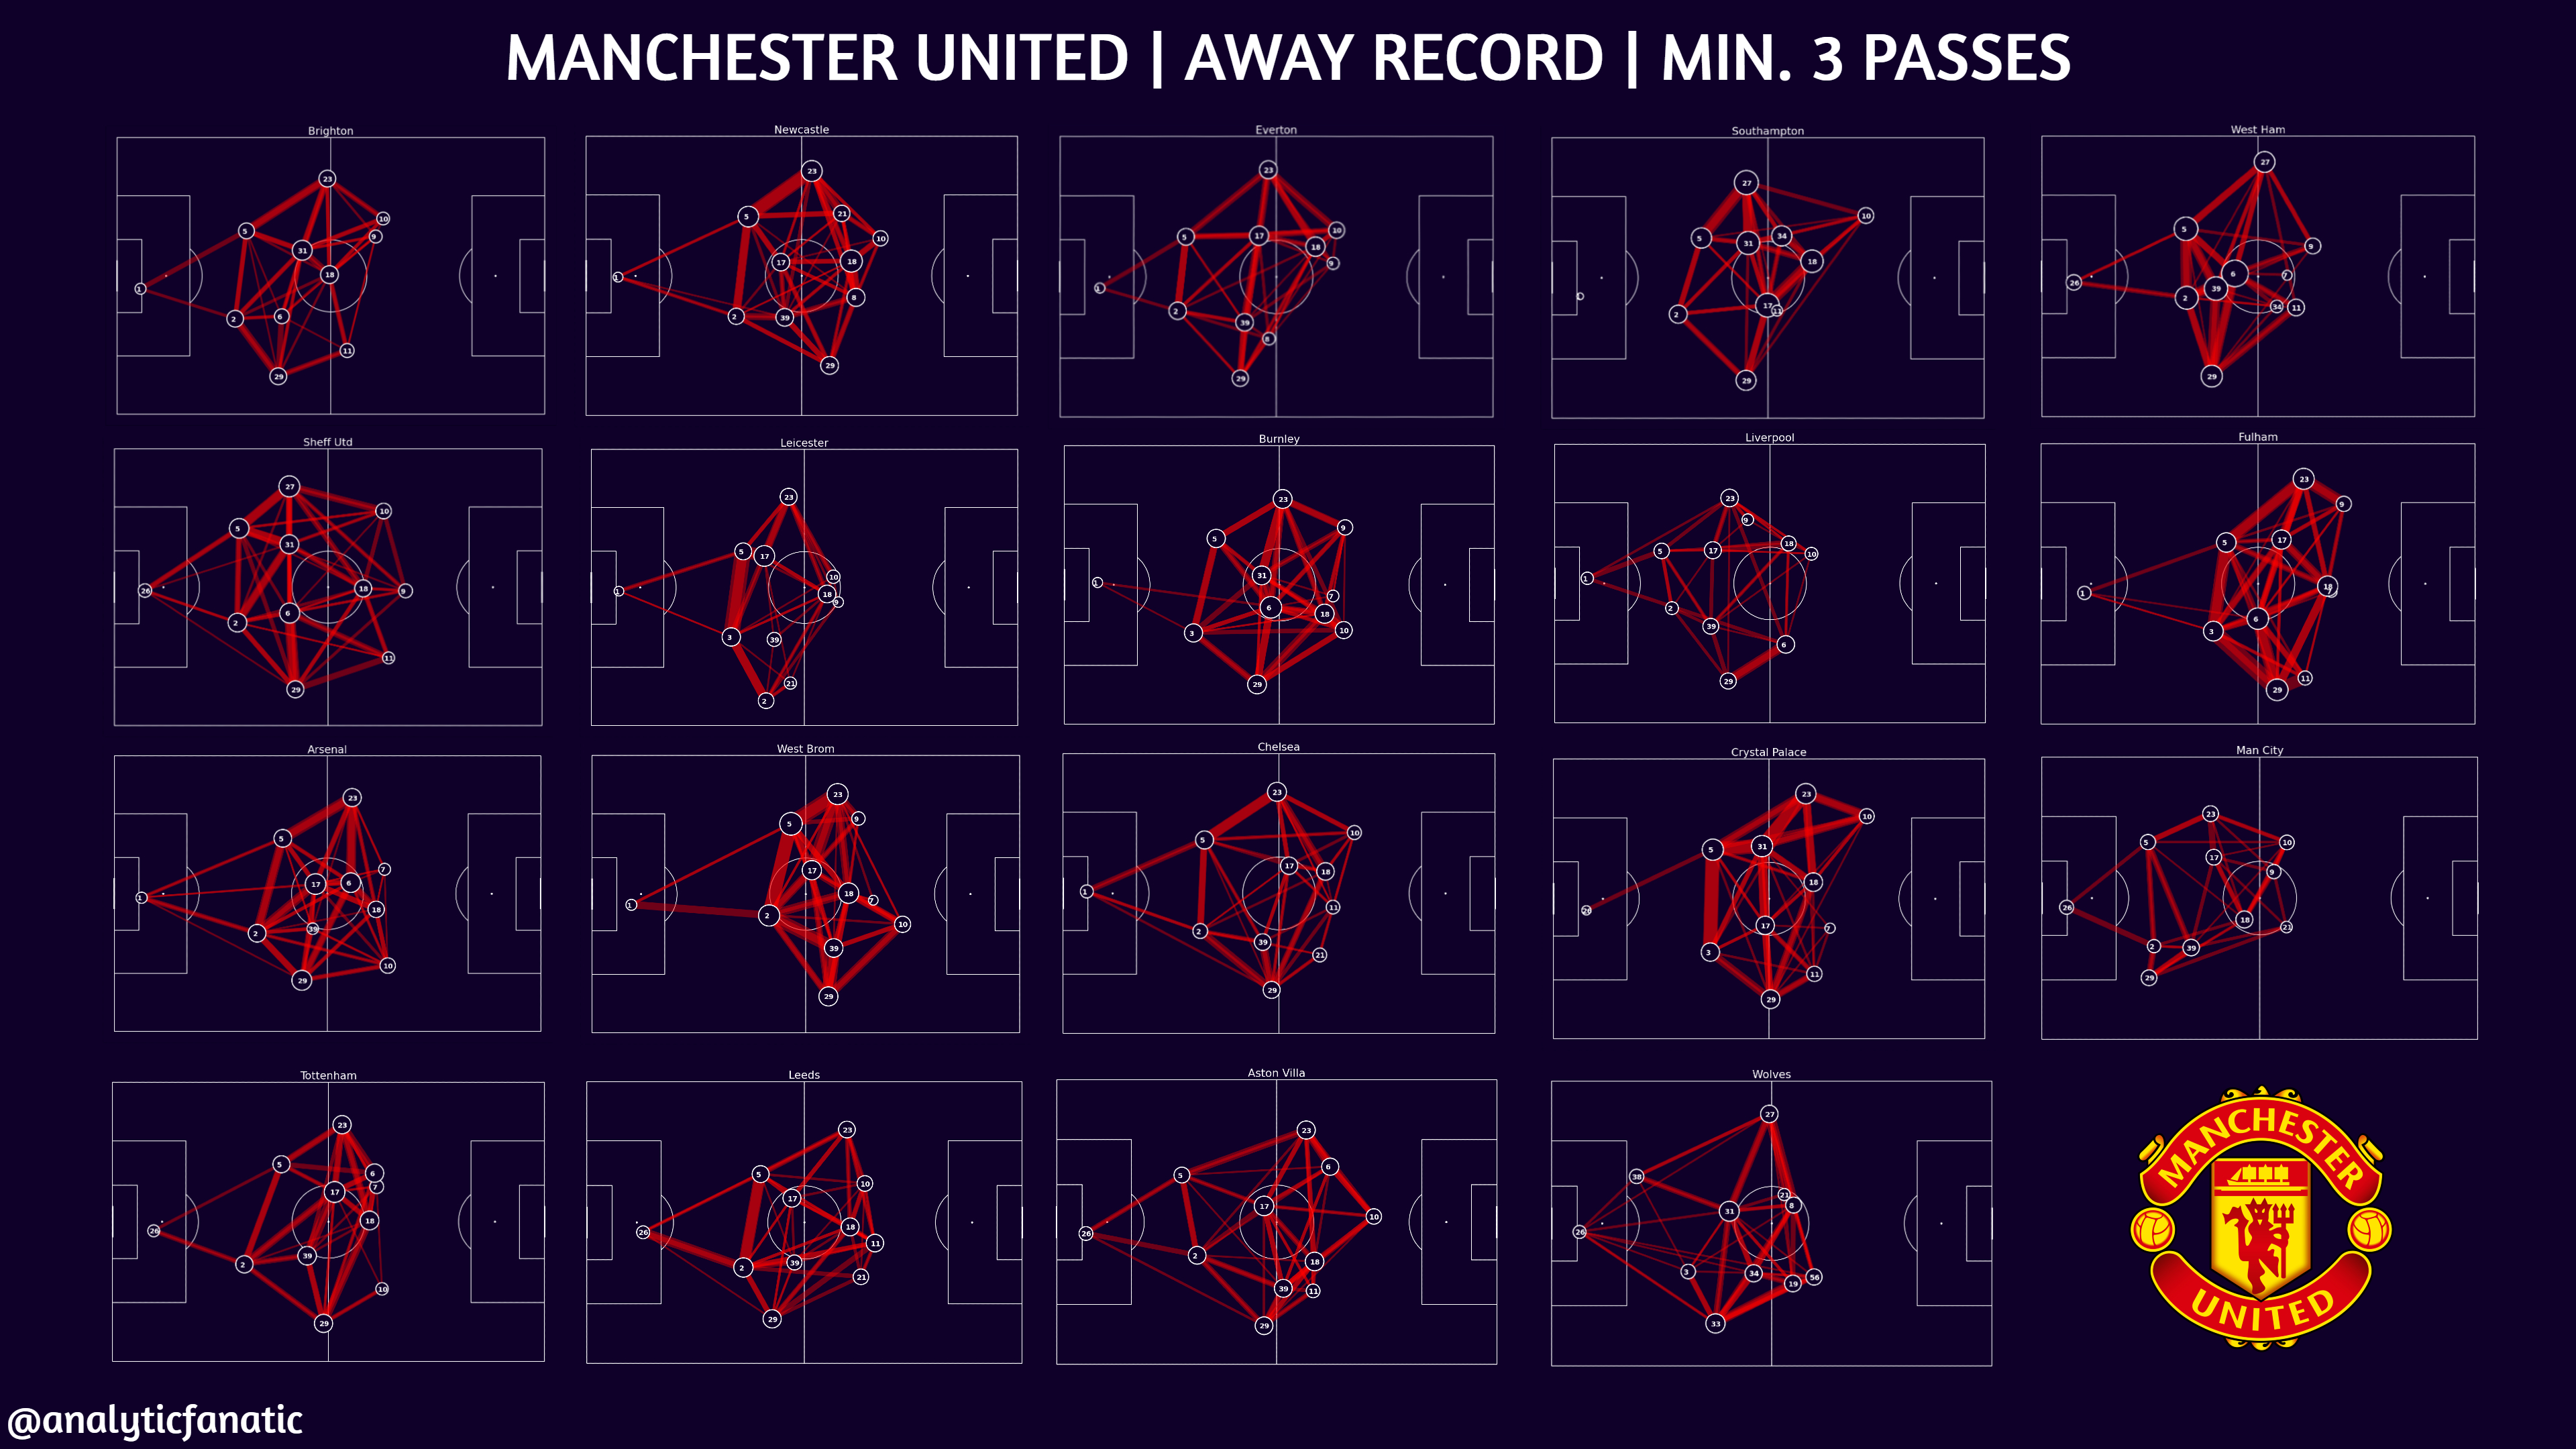
Manchester United ended the Premier League season with an unbeaten away record. This was their average shape and pass frequency.